Image Chart Trader
Hypothesis: a vision model reading chart pictures, not hand-engineered indicators — scale-down groundwork before spending real API calls on it.
The hypothesis
Every feature set this project has tried feeds the trading population numeric summary statistics — RSI, MACD, SMA distances, raw-return spectra. A human day trader doesn't read a spreadsheet of those numbers; they look at charts: a 1-minute chart for immediate action, a 5-minute chart for the intraday session's shape, a daily chart for the last few months of context. The proposal is to render those 3 charts every time a decision is needed and have a vision-capable model read them the way a human does — pattern and trend by eye, not a hand-computed indicator.
A vision-LLM call costs real money and real seconds per call — there is no version of "2,000 traders, each looking at 3 charts, every minute" that is remotely affordable at this population's scale. The realistic design calls the model once per coarse decision interval and shares its read across the whole population, rather than once per trader.
Before spending API calls: how small can these get?
A cheap human-eyeball proxy for "what's the minimum image size a vision model needs," done before any real LLM call: take one chart at native render size (1820×910), downscale it with high-quality resampling to a series of smaller widths — the same kind of resize a vision model's own preprocessing applies — and look at what survives at each size.
| Width | What survives |
|---|---|
| 1024px | Fully readable, no visible loss. |
| 512px | Axis/legend text small but legible; SMA crossovers and trend shape read clearly. |
| 256px | Axis/legend text no longer legible — just colored smudges. Trend direction and roughly where the SMA lines cross are still visible by shape alone. |
| 128px | Numeric/text content entirely gone. Only the coarsest shape survives — the SMA(50) line nearly blends into the background on the noisier 1-minute chart. |
Daily — 1024px down to 128px
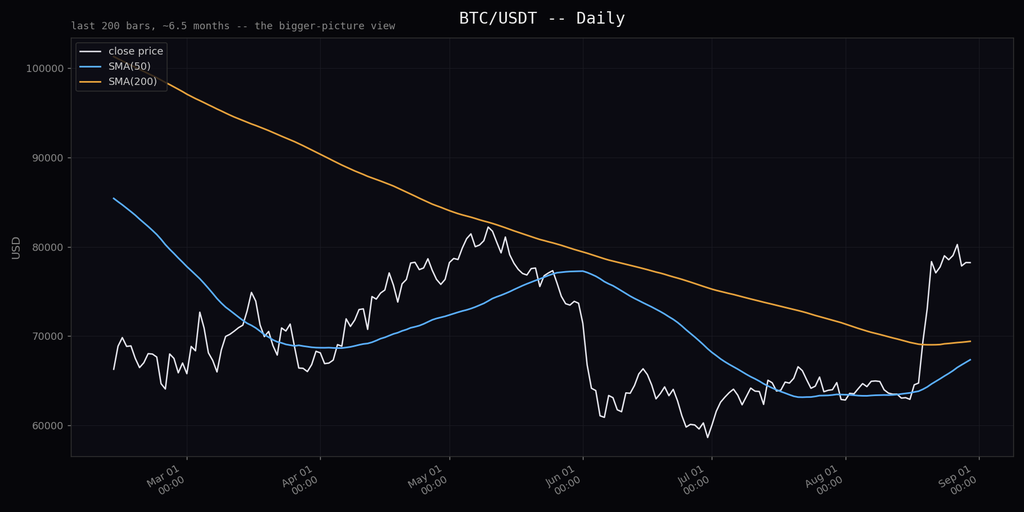 1024px
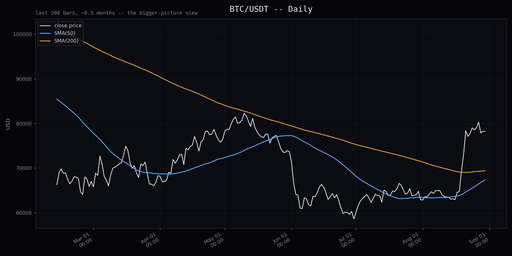 512px
512px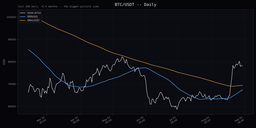 256px
256px 128px
128px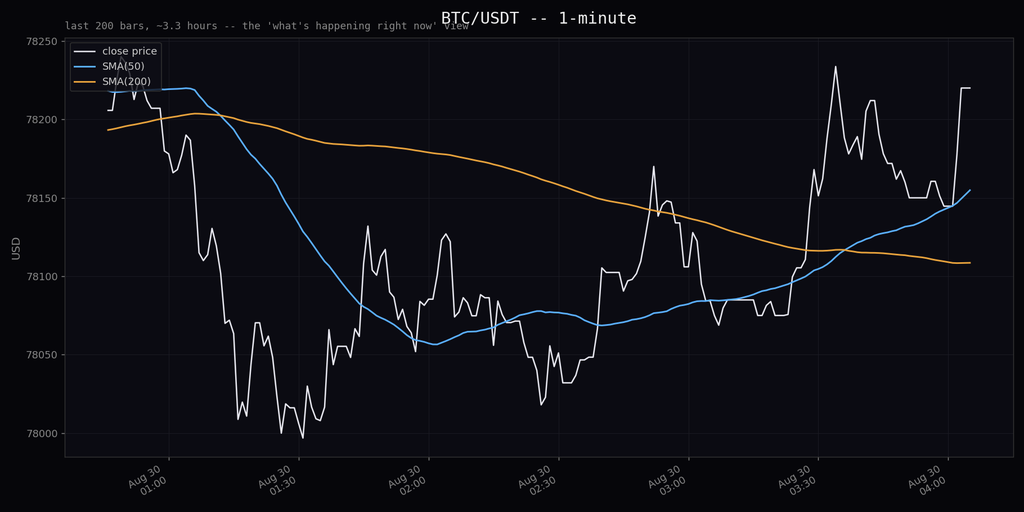 1024px
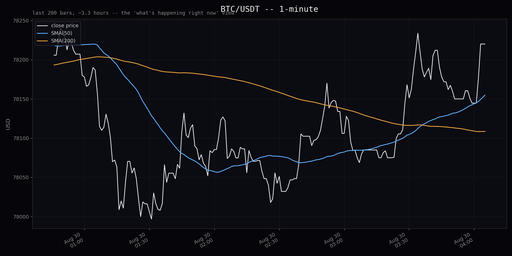 512px
512px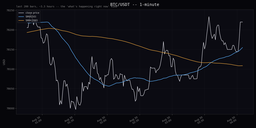 256px
256px 128px
128px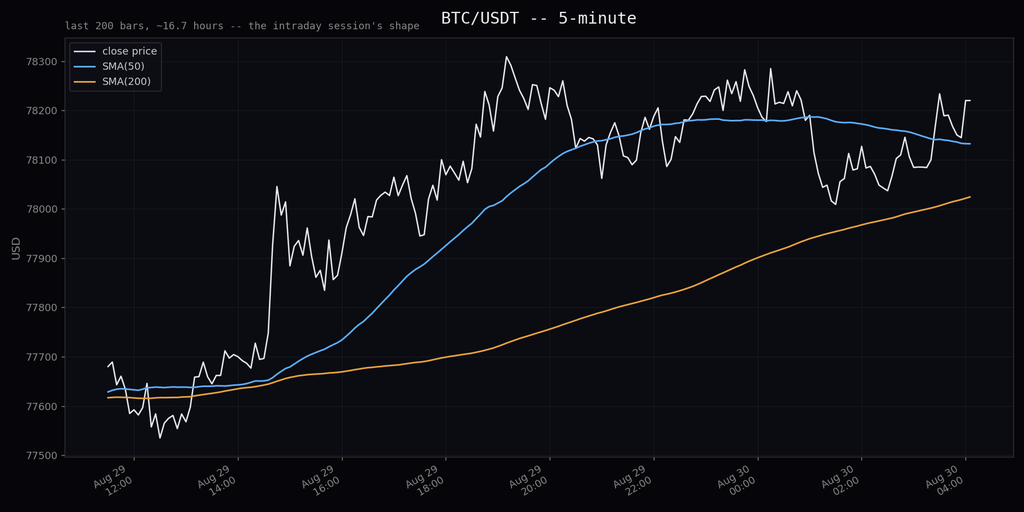 1024px
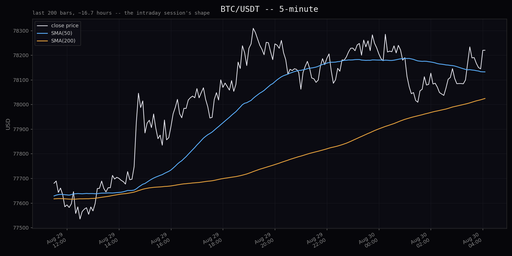 512px
512px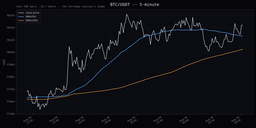 256px
256px 128px
128pxFirst-guess takeaway
- Structural read (trend direction, SMA crossover, rough pattern shape) survives down to ~256px wide, even though all text is gone by then.
- Anything needing the axis (exact price levels, exact timestamps, a specific support/resistance price) needs at least ~512px, realistically 768px to be safe.
- The native 1820px render is very likely overkill for what a vision model actually needs — if that holds up under a real LLM test, it's a meaningful cost/latency lever, since image size drives vision token count.
- Not a real test yet. A vision encoder tokenizes a resized image through its own patch/tile pipeline, which doesn't necessarily degrade the way human perception does. The real next step: feed these same downscaled files to an actual vision LLM and compare its structured read against the 1820px original.