Vision Trading Experiment — Report
Can a GA-evolved CNN trade profitably off chart images alone? 16 logged steps, ~30 hours of compute, one clear answer.
Bottom line
No. Not because of any one bug — five independently-motivated fixes to the image/CNN pathway (GA selection pressure, restoring lost magnitude info, an 11x capacity cut, an ~1.5x capacity increase, and genuinely higher-quality anti-aliased rendering) were each tried in turn, and every one landed in the same place: the trained policy failed to generalize to unseen market regimes. The only intervention that ever changed the outcome was removing the chart image entirely and using 12 hand-picked numeric features instead — which won decisively in one regime (bull, 8/8 seeds) but still failed in the other three.
This report is the condensed version of a much longer, step-by-step log. It's organized as a narrative — what was tried, what broke, what the evidence actually showed at each turn — because the process of ruling things out is most of the value here, not just the final table.
Setup & rules
A tiny CNN (initially 4 conv filters + a 12-unit dense layer, ~8,455 parameters) reads 3 rasterized chart images per decision tick — 1-minute, 5-minute, and daily BTC/USDT, each showing close price + SMA(50) + SMA(200) — plus a handful of position-state numbers (in a trade or not, unrealized P&L, elapsed hold time). It outputs one "conviction" score, thresholded into buy/hold/sell. A population of 150 such networks is evolved by a genetic algorithm: rank by fitness, keep the elite, breed the rest via crossover + mutation, repeat for 40+ generations. Hourly decision cadence, 8-hour forced close, realistic ~0.1%-per-side fees.
Holdout discipline: 4 regime windows (bull, bear, flat/range, volatile/crash) were fixed at the start and never touched during training or tuning — only evaluated, once, when a design was frozen. Every "did it generalize" claim in this report is against those 4 windows or a separate never-trained-on validation slice, not against the training data itself.
First proof: does it work at all?
Trained on a 4-month 2021 slice with the simplest possible fitness function — raw cumulative trading profit. Evaluated once on the 4 holdout regimes.
NegativeLost money in all 4 holdout regimes; underperformed a random coin-flip policy in 3 of 4; beaten by a trivial SMA(50/200) crossover everywhere. Average hold time was ~1.4h against an 8h allowance — a strong overtrading signal.
Finding the shortcut
Before trying to fix anything, two controls tested whether the GA was reading the charts at all, versus exploiting something else.
Image-ablation control
Every image zeroed out — the network could only see 3 position-state numbers, which are a
constant (0,0,0) whenever flat. Result: this blind policy reached 75% of the
real run's training fitness, and beat the real vision-based policy in 3 of 4 holdout
regimes. It had evolved into a crude "always buy, hold to the forced-close ceiling" heuristic
— average hold landed almost exactly on 8h in every regime.
Shuffle control
Real images, but each tick showed a randomly reassigned other tick's chart — severing the image-to-price relationship while keeping real prices in true order. Result: training fitness was statistically indistinguishable from the correctly-aligned run. The GA found an equally-good "solution" with the chart-to-moment correspondence completely destroyed.
Root cause foundRaw-return fitness rewards any profitable behavior, regardless of whether it came from reading the picture. The GA had a free, degenerate shortcut — ignore the image, go long, ride to forced close — and took it.
The fix, and its limits
Changed fitness to vision-contingent: each genome's score became its real-image return minus its own return on the same ticks with images shuffled. A genome that ignores the image scores ~0 either way, closing the shortcut directly. (A constant baseline subtraction, e.g. a fixed buy-and-hold offset, would not have worked — selection is rank-based, and a uniform shift across the population doesn't change who's selected. The penalty has to be per-genome.)
First run (one seed): mechanically confirmed working — the trained genome scored measurably worse on shuffled images than real ones. Holdout result was mixed: bull flipped from a loss to a real gain beating ~90% of random draws — the first result across every run so far to clear that bar. Bear got meaningfully worse.
Multi-seed replication (10 seeds)
| Regime | Wins / 10 seeds | Mean return | Range |
|---|---|---|---|
| Bull | 1/10 (seed 0 only) | -6.4% | +3.3% to -20.8% |
| Bear | 0/10 | -37.5% | -8.1% to -60.1% |
| Flat | 0/10 | -19.1% | -8.7% to -31.6% |
| Volatile | 0/10 | -22.7% | -0.1% to -33.4% |
Bear, flat, and volatile lost money in every one of the 10 independent runs. Bull made money exactly once, in 40 regime×seed combinations. The vision-contingent fix genuinely closed the shortcut — but that mechanistic fix alone did not produce a policy that generalizes.
Scaling up: an unexpected bug hunt
A diagram of the training window against the 4 holdout windows, plotted over the full BTC price history, revealed the 4-month training window sat immediately adjacent to the bull holdout — both inside the same 2020-2021 mega-rally, not a genuinely independent regime. Plausible explanation for why bull was the only regime to ever show a win.
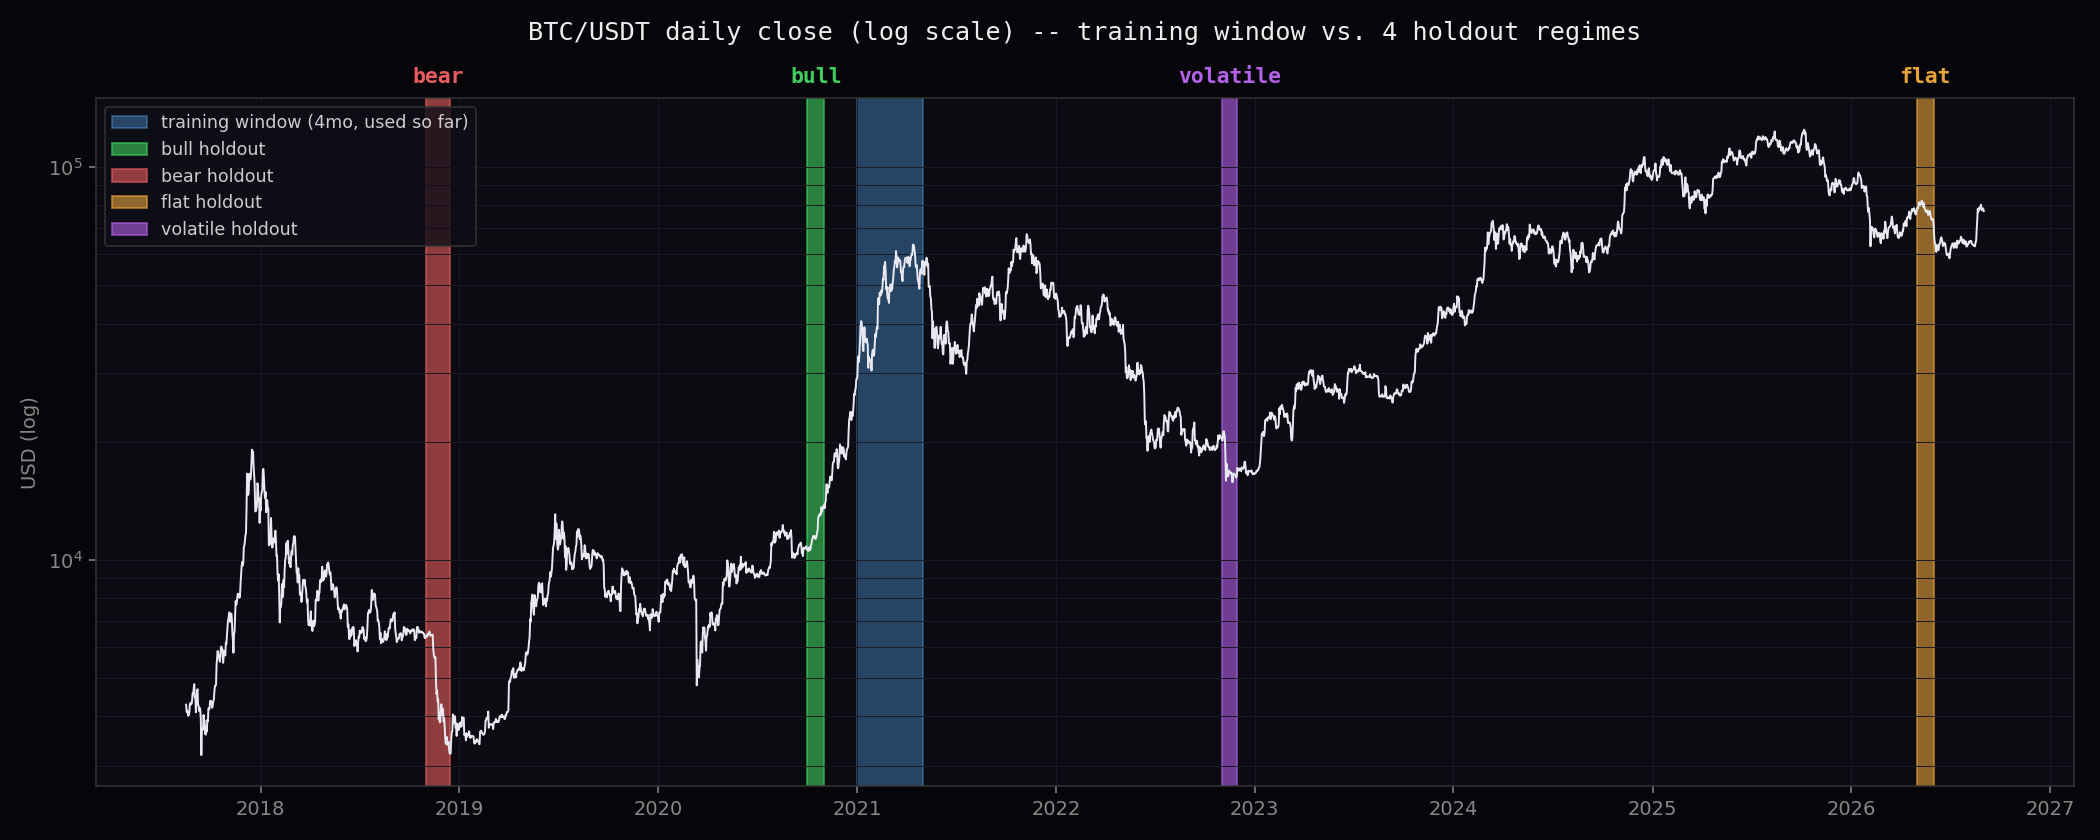
Picked a much larger, more diverse training pool (~3.75 years, ~32,850 ticks spanning 2019 chop, the COVID crash, the full 2020-2021 bull, and the 2022 decline) and re-ran. Along the way, a safety assertion caught a real overlap bug before any compute was wasted, which surfaced a deeper design gap: naively concatenating two non-adjacent date ranges would let a position "hold" across the gap between them. Fixed with a proper multi-episode simulator, verified bit-identical to manually summing independent per-segment runs.
The apparent fitness-function bug
At the larger scale, training return was negative in every generation (ending around -83% loss) while the vision-contingent excess score kept climbing regardless — looking exactly like a broken objective (a genome could win by being differently bad with real vs. fake images, rather than genuinely good with real ones).
Before redesigning: checking the data already on hand
Rather than assume the diagnosis, the trade-count vs. return relationship was checked in the saved training histories (no new compute). Trade count correlated strongly with worse returns at both scales, and was declining over generations at both scales too — the large-scale run looked like it was on the same improving trajectory as the small scale, just starting from more ticks and not given enough generations to finish taming it. Two competing hypotheses, made falsifiable and pre-registered before running anything further:
- H_B — just needs more time: return keeps improving with more generations, tracking declining trade count.
- H_A — structurally broken: return plateaus while the excess score keeps climbing anyway.
Test: an intermediate-scale run (~8,760 ticks) for 120 generations instead of 40 (3x, matching the ~3x tick-count increase).
H_B confirmed, H_A refutedReturn climbed smoothly the entire run — crossed positive around generation 31, reached +1.43 (≈+318% training-set return) by generation 119, the same trajectory shape as the small-scale run. The fitness function was never broken; 40 generations just wasn't enough search time at 11x the scale. Extrapolating, the original large-scale run would need ~400-450 generations (~25-30h) to reach comparable convergence.
But — evaluated on holdout, this genuinely-converged, genuinely-profitable-on-training genome still failed everywhere: bull never opened a single position, bear -41.1%, flat -20.6%, volatile -33.6%, all losing to random. This cleanly separated two previously-tangled questions: the optimizer works fine (confirmed); a converged policy still doesn't generalize (a real, independent problem).
Five root-cause tests
With the fitness function cleared, five independent, targeted fixes were tried against the same 10-seed baseline, each addressing a different plausible cause.
1. Aggressive GA culling
Motivated by a recurring "lack of trading" pathology (bull holdout sometimes showing zero trades). Cranked selection pressure — only the top ~3 and top ~15 of 150 survive/breed, instead of 15 and 45.
Made it slightly worseBull went from 1/10 wins to 0/8; every regime's mean return declined. Harsher selection just accelerated convergence toward the same already-overfitting genomes, and shrank population diversity faster.
2. Numeric-feature baseline (no image at all)
Replaced the CNN entirely with a ~200-parameter MLP over 12 hand-picked technical features (SMA distances, recent return, recent volatility) — the "what if we'd never bothered with vision" sanity check.
The one result that changed anything| Regime | Wins / 8 seeds | Zero-trade (sat out) | Mean return |
|---|---|---|---|
| Bull | 8/8 | 0/8 | +8.0% |
| Bear | 0/8 | 2/8 | -22.4% |
| Flat | 0/8 | 1/8 | -13.5% |
| Volatile | 0/8 | 1/8 | -20.3% |
Bull went from 1/10 to 8/8 — a qualitative reversal, not a marginal gain. Two seeds learned to sit out bear/flat/volatile entirely (exactly 0% return, meaning zero trades) while still trading bull profitably — something the CNN genomes almost never did.
3. Scale-reference side-channel
Diagnosed a concrete gap: every chart image is normalized to its own window's min/max, so a 2% wiggle and a 40% move can render as pixel-identical shapes. Added 6 numbers (window range %, net return % per timeframe) as a side-channel — never shuffled, so the vision-contingent check still measured the image's own contribution.
Did not help0/3 bull wins, every regime mean slightly worse than the original. Restoring the missing magnitude signal alongside the full image didn't help — suggesting the bottleneck isn't one missing number, it's the image-processing pathway itself.
4. Shrinking the CNN's capacity 11x
Same 20×40×3 image, but 1 conv filter and a 4-unit dense layer instead of 4 filters/12 units — 759 parameters instead of 8,455, testing whether sheer capacity (relative to the numeric baseline's ~200) was driving the overfitting.
Did not help0/3 bull wins, bull and bear slightly worse, flat slightly better, no net improvement. An 11x capacity cut did not fix generalization.
5. Real anti-aliased rendering
Swapped the fast pixel-snapping rasterizer for genuine matplotlib rendering — proper anti-aliasing, smooth curves, no blockiness — at a modestly larger 24×48 size, same information content (close + SMA50 + SMA200), isolating rendering quality as the one changed variable.
Statistically indistinguishable from the crude rasterizer0/3 bull wins, same magnitude of loss in every regime as every other CNN variant. Better pixels didn't matter.
Final evidence table
| Condition | Params | Image quality | Bull wins | Bear / Flat / Volatile wins |
|---|---|---|---|---|
| Original CNN | 8,455 | fast rasterizer | 1/10 | 0/10, 0/10, 0/10 |
| Aggressive culling | 8,455 | fast rasterizer | 0/8 | 0/8, 0/8, 0/8 |
| + scale-reference | 8,461 | fast rasterizer | 0/3 | 0/3, 0/3, 0/3 |
| Small CNN (11x smaller) | 759 | fast rasterizer | 0/3 | 0/3, 0/3, 0/3 |
| Quality-rendered CNN | 12,391 | real anti-aliasing | 0/3 | 0/3, 0/3, 0/3 |
| Numeric baseline, no image | ~200 | n/a | 8/8 | 0/8, 0/8, 0/8 |
Five independently-motivated interventions on the image/CNN pathway — GA selection pressure, restoring lost magnitude info, an 11x capacity cut, an ~1.5x capacity increase, and genuinely higher-quality rendering — all converge on the same failure mode. None moved the needle. Only discarding the image entirely changed the outcome, and only in one regime.
Honest conclusion
Within this project's specific framework — a GA-evolved, few-thousand-parameter network, trained on a few thousand to tens of thousands of ticks — a 3-timeframe chart image does not appear to carry learnable, generalizable trading signal. Not because of rendering quality, not because of network capacity, not because of missing scale context, and not because of GA selection pressure. Every lever tried on the image side failed to change the outcome; the one lever that changed anything was removing the image.
This doesn't prove chart images can never work for this task — a fundamentally different training regime (a pretrained vision model, or orders of magnitude more data) might behave differently. But for this project's specific approach, it's a fairly complete answer: not much comes out of the pictures, at this data scale.
Still fully open
- Bear, flat, and volatile regimes remain unsolved even under the winning numeric baseline — bull is the only regime any approach has ever cracked.
- Whether genuine training-data diversity (many different market eras mixed into one training pool, not just a longer contiguous window) would help the numeric approach generalize further.
- Whether a fundamentally different regime — a pretrained vision-language model instead of a from-scratch CNN — changes any of this. See the Image Chart Trader page for the groundwork already done on that question (image-size requirements for a vision-LLM read).