Chart Report
Real experiments, real (mostly negative) results -- lives in its own sibling repo, jrodimusprime/BTC-Chart-GA-Trader. This page mirrors that repo's README, SCALE_EXPERIMENT.md, and EXPERIMENT_LOG.md so the actual research is visible on the site, not just in git history.
The idea
Every feature set tried in btc-ga-trader (33-dim, 802-dim, 2400-dim multiframe) feeds the trading net numeric summary statistics -- RSI, MACD, SMA distances, raw-return spectra. A real human day trader doesn't read a spreadsheet of those numbers; they look at charts. The proposal: render charts the way a trader would actually glance at them, and have a vision-capable model (or a CNN evolved by the same GA machinery) read them as part of the decision.
Option A -- hybrid (probably the right one for production): LLM as a shared feature extractor, GA population unchanged. Call a vision model once per coarse decision interval to distill charts into a handful of structured, cheap numeric reads (trend, support/resistance, pattern, confidence) that feed the existing, unchanged 2,000-genome GA -- the LLM is called once per tick, not 2,000 times.
Option B -- a small CNN evolved directly by the GA, no external LLM call at all. This is the one actually built and tested below: a tiny convolutional network (~8.4k params) reads rasterized chart images directly, with its weights evolved the same way every other genome in this project is (mutation/crossover/cull), no API cost or latency per decision at all.
What the charts actually show
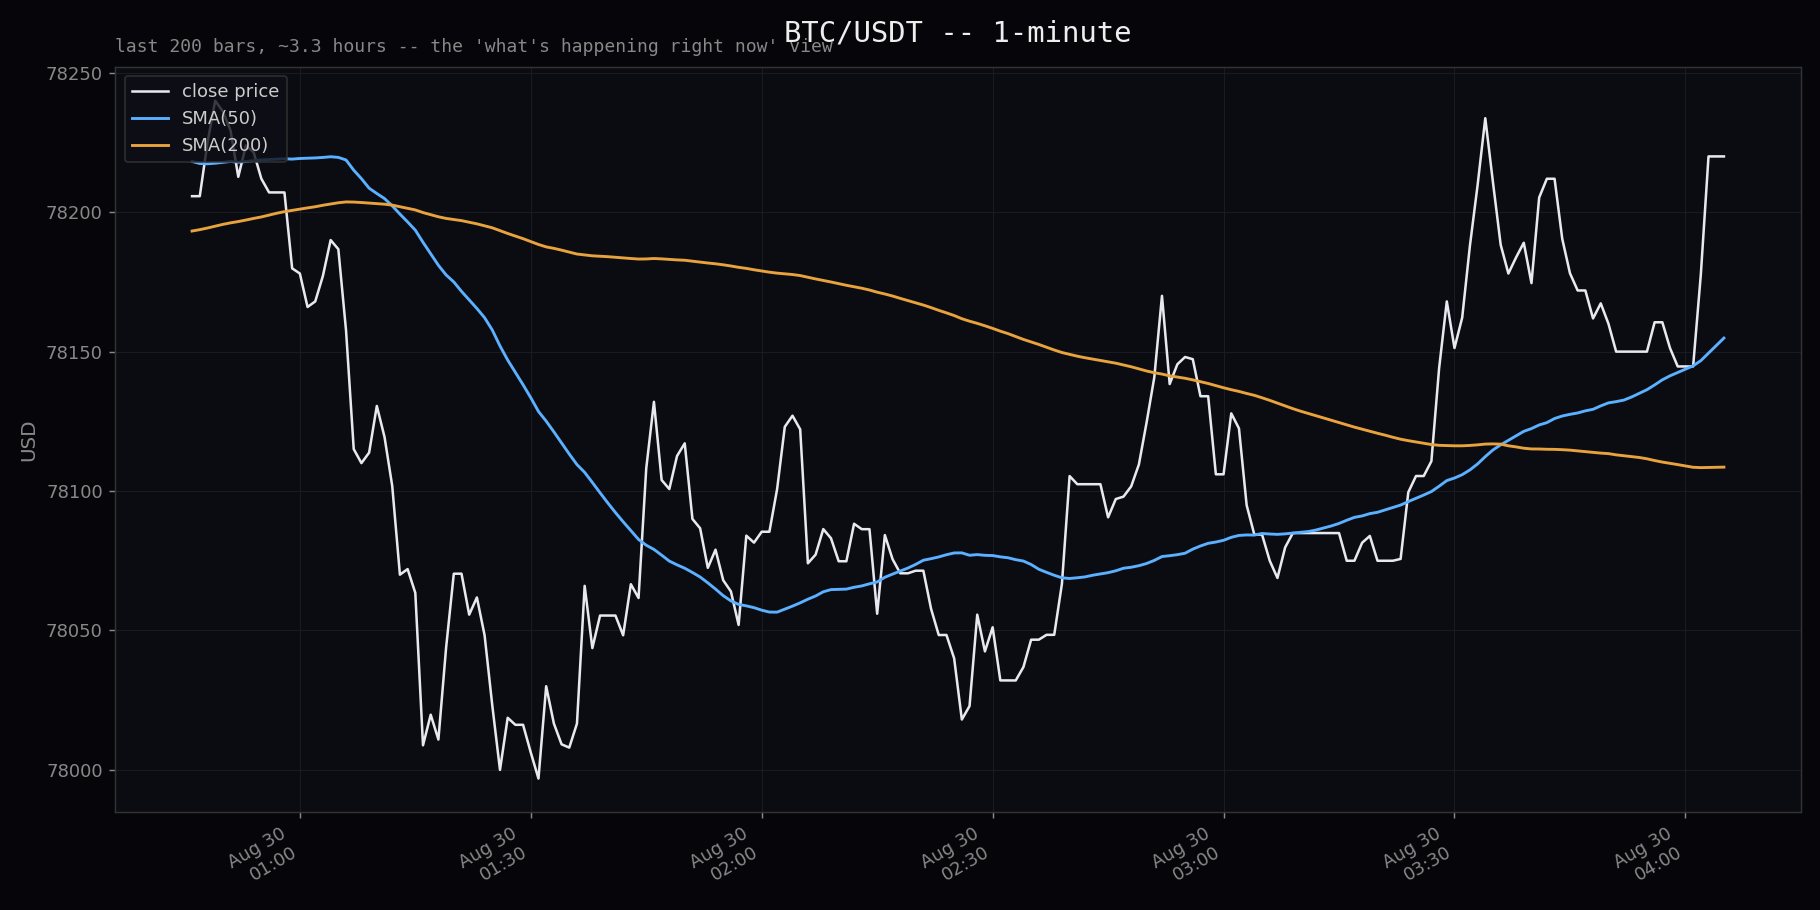
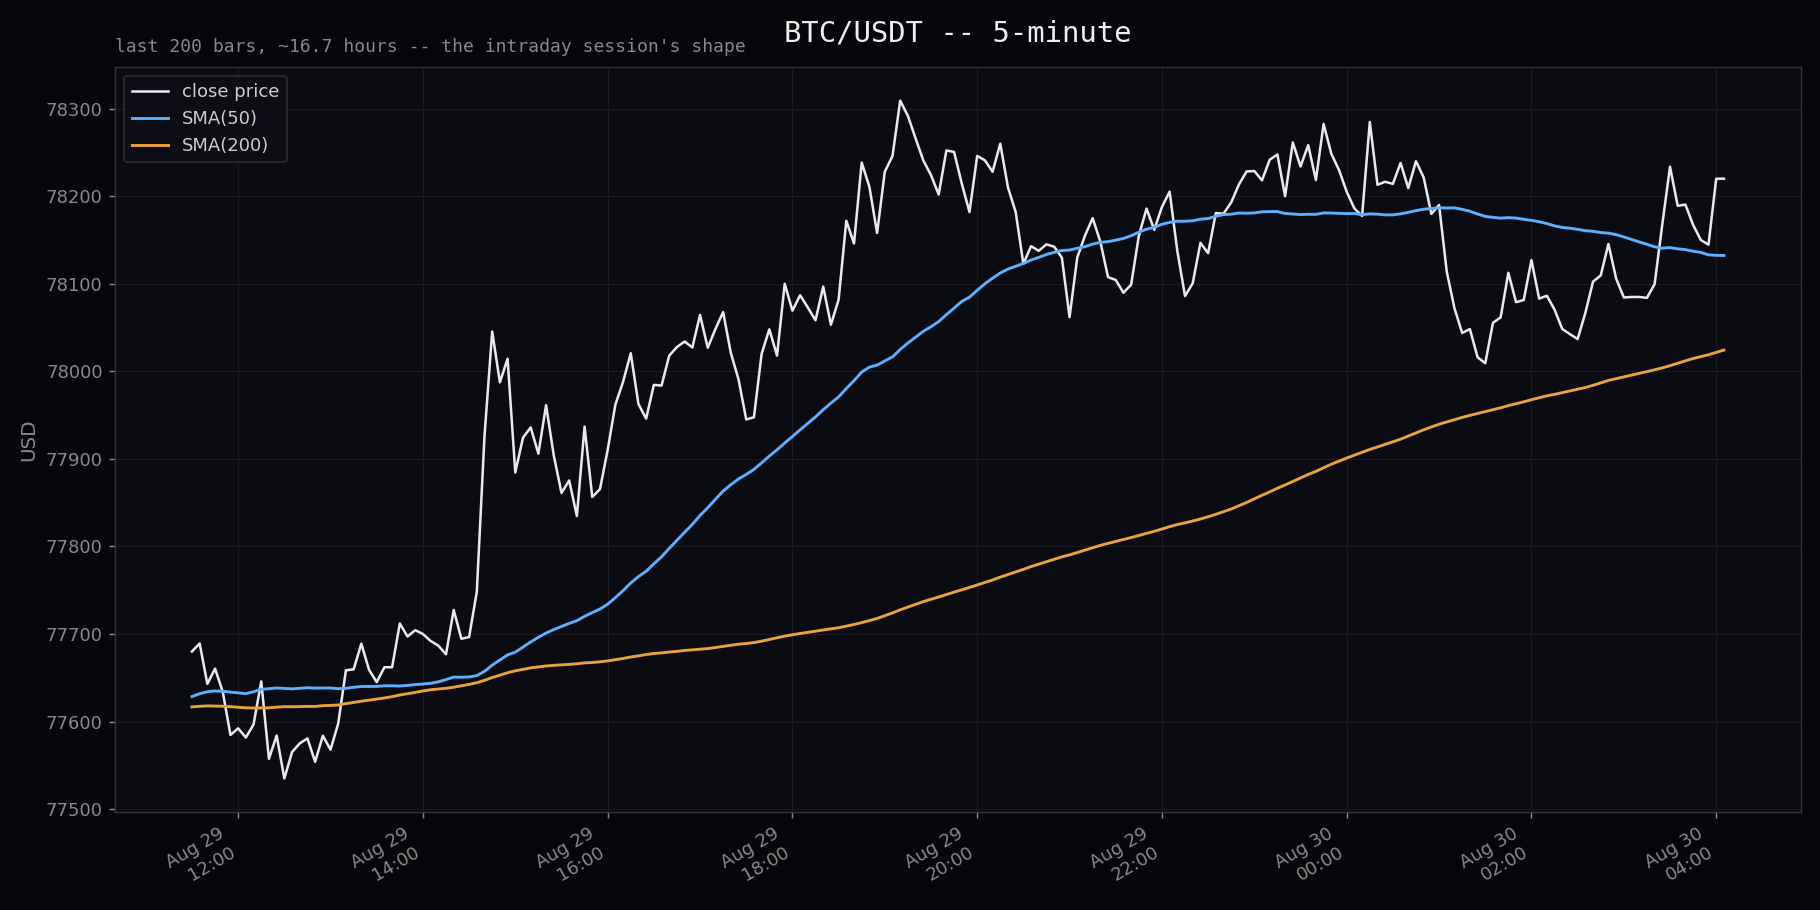
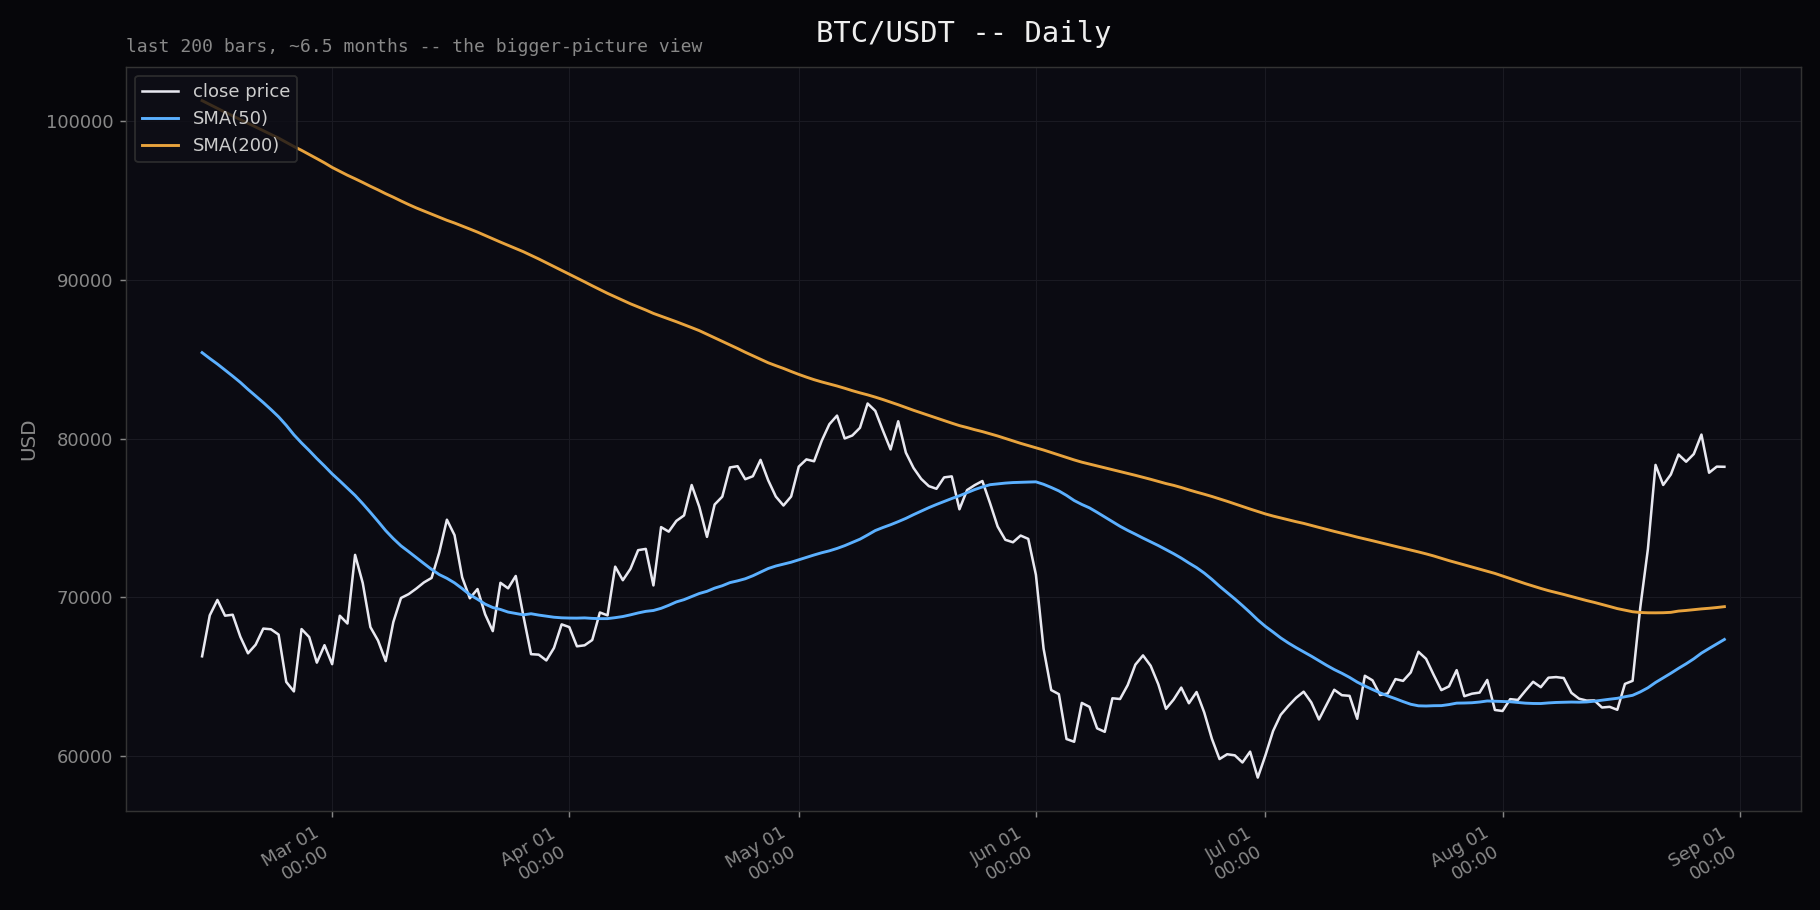
Rendered from real archived BTC data, not mockups. The archive has only timestamp and close price -- no OHLC, no volume -- so these are close-price line charts with SMA(50)/SMA(200) overlaid, not candlesticks.
1-minute (~200 bars, ~3.3 hours)
5-minute (~200 bars, ~16.7 hours)
Daily (~200 bars, ~6.5 months)
How small can these get? (scale experiment)
Image size drives vision-API token count and cost directly, so before spending real API calls: a cheap human-eyeball proxy, downscaling the native 1820×910 render with high-quality resampling and checking what survives. Finding: structural read (trend direction, SMA crossover, rough pattern) survives down to ~256px wide even though all axis/legend text is gone by then; anything needing an exact price level needs at least ~512px. The native 1820px render is very likely overkill for what a vision model actually needs.
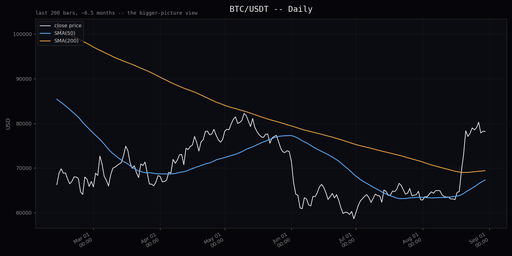
512px -- fully legible
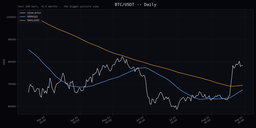
256px -- text gone, shape survives
128px -- only coarse trend shape left
Agent experiment: does it actually work? (real results, mostly negative)
A real pipeline was built: a fast numpy chart rasterizer, a tiny CNN (~8.4k params) evaluated batched across a GA population, a walk-forward portfolio sim (8h forced close, realistic fees, long-only), evolved on a 2021 training slice and evaluated on 4 never-touched holdout regimes (bull/bear/flat/volatile).
Step 1 -- first proof: negative
Lost money in all 4 holdout regimes; underperformed a random coin-flip policy in 3 of 4; beaten by a trivial SMA(50/200) crossover everywhere. Average hold time was ~1.4h against an 8h allowance -- a strong overtrading/noise-chasing signal, consistent with overfitting a single 4-month training slice.
Steps 3-4 -- was it even reading the chart? No.
Two controls, same window/seed: image-ablation (every image zeroed) reached 75% of the real run's training fitness and beat the real vision-based policy in 3 of 4 holdout regimes (a policy that cannot see a single pixel outperformed the one that could). Shuffle control (real images, but each tick sees a randomly reassigned other tick's image) reached training fitness statistically indistinguishable from the real run. Conclusion: raw-return fitness let the GA win via a degenerate shortcut -- ignore the image, go long, ride to forced close -- that has nothing to do with reading a chart.
Step 5 -- fix: vision-contingent fitness
Fitness changed to per-genome excess of real-image return over that same genome's return on shuffled images, recomputed fresh every generation -- a genome that ignores the image scores ~0 excess either way, closing the shortcut directly. Mechanically confirmed working (+0.73 real vs. an implied -1.40 shuffled). Holdout: bull flipped from -9.67% to +3.30% (beats ~90% of random, the first result across every run to clear that bar) -- but bear got meaningfully worse (-51.33%) and flat/volatile stayed solidly negative.
Step 6 -- 10-seed replication: the bull win didn't hold up
Bear, flat, and volatile lost money in every single one of 10 independent training runs. Bull made money exactly once in 40 regime×seed combinations -- seed 0's earlier result was an outlier, not a repeatable capability. The regime diagram below shows why: the training window sits immediately adjacent to the bull holdout, both inside the same 2020-2021 mega-rally -- not a genuinely independent regime.
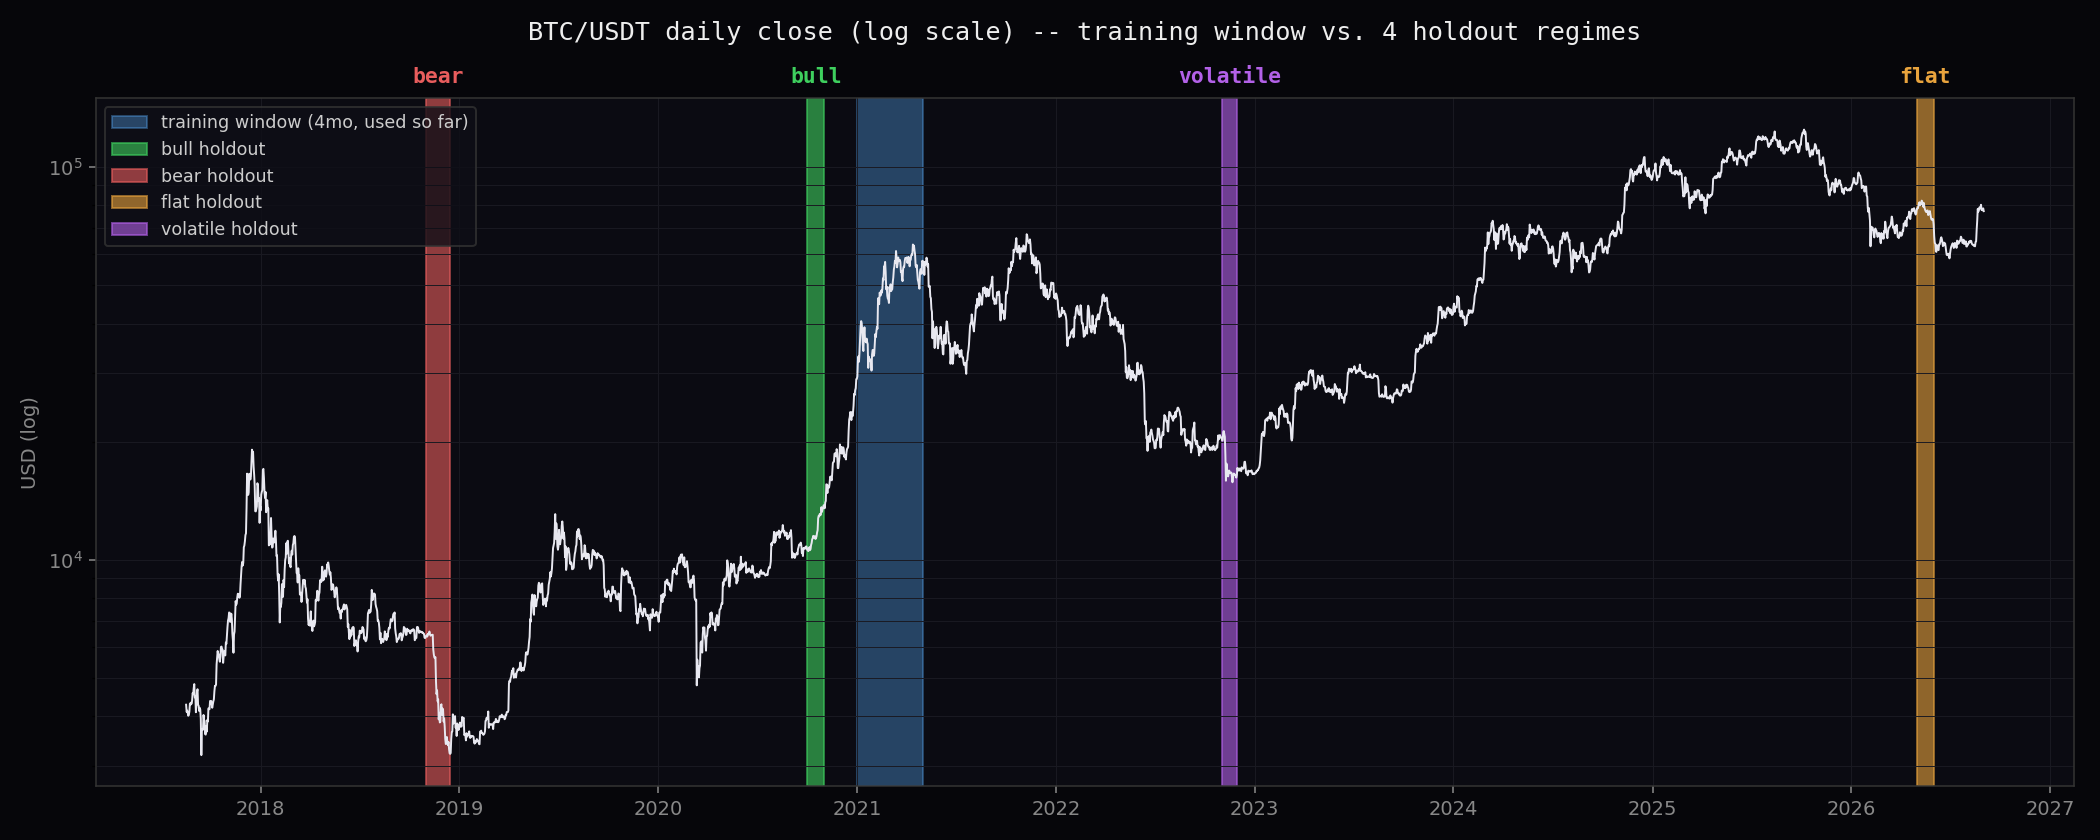
The vision-contingent fitness fix genuinely closed the always-long shortcut (confirmed mechanistically) but does not translate into a policy that generalizes profitably in any tested regime, across repeated independent training. Not "needs more tuning" -- a consistent, replicated failure to generalize.
Step 7 -- scaling up: a new bug caught, then a new fitness gap found
Before scaling training data ~11x (2019-01 to 2022-10, ~3.75 years spanning the 2019 range, the COVID crash, the full 2020-2021 bull, and the 2022 decline), a safety check caught a real bug pre-training: the naive date range overlapped the bull holdout window. Fixed by splitting into independent episodes around the gap -- verified bit-identical to running each segment separately and summing.
At the larger scale (one seed, ~2.6h of training), a new, more fundamental gap surfaced: raw training-set return was negative in every one of 40 generations (-83% loss) while the vision-contingent score climbed the whole time. On holdout: bull never opened a single position; bear/flat/volatile solidly negative. Diagnosis: vision-contingent fitness only rewards a genome for responding differently to real vs. scrambled images -- it says nothing about whether that response is profitable. A genome that loses money with real images but loses even more with shuffled ones scores a large positive excess while still being a net loser. This is a design gap in the fitness function itself, not something more training data could fix.
Status: fix identified, not yet implemented -- a fitness function requiring both
real profitability and vision-contingency (e.g. raw_return + λ · excess)
so a genome can't win purely by being differently-bad with real vs. fake images. No
further large-scale training runs until this lands, to avoid re-finding the same failure
mode at higher cost.
Relation to the main project's whitepaper
btc-ga-trader's own WHITEPAPER.md never tested chart images or vision models -- it's entirely about the numeric-feature GA (evidence backtest, organic evolution, a 54-variant structural search), all converging on "the population correctly learns not to trade, because trading has negative expected value at this cost structure." PREDICTIVE_SIGNAL_FINDING.md added a decoupled, non-GA check (ridge regression) confirming thin-but-real numeric signal that doesn't clear realistic costs. This project is the closest thing to a parallel investigation of the same underlying question -- is there learnable structure, or does every method just find a degenerate shortcut -- using a completely different representation (images, evolved CNN weights instead of hand-engineered numeric spectra). So far the answer rhymes: real effort to close every shortcut found (image-ablation, shuffle control, vision-contingent fitness), and still no profitable, generalizing policy in any tested regime.